for the people who want to talk about movies and ![]() as some people complain when we do this in other parts of the forum
as some people complain when we do this in other parts of the forum


1 Like
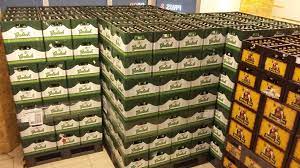
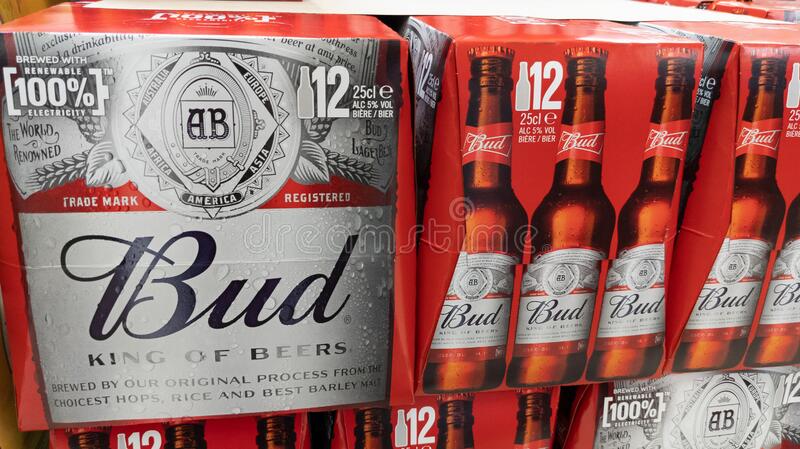
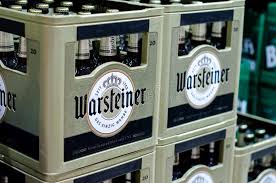
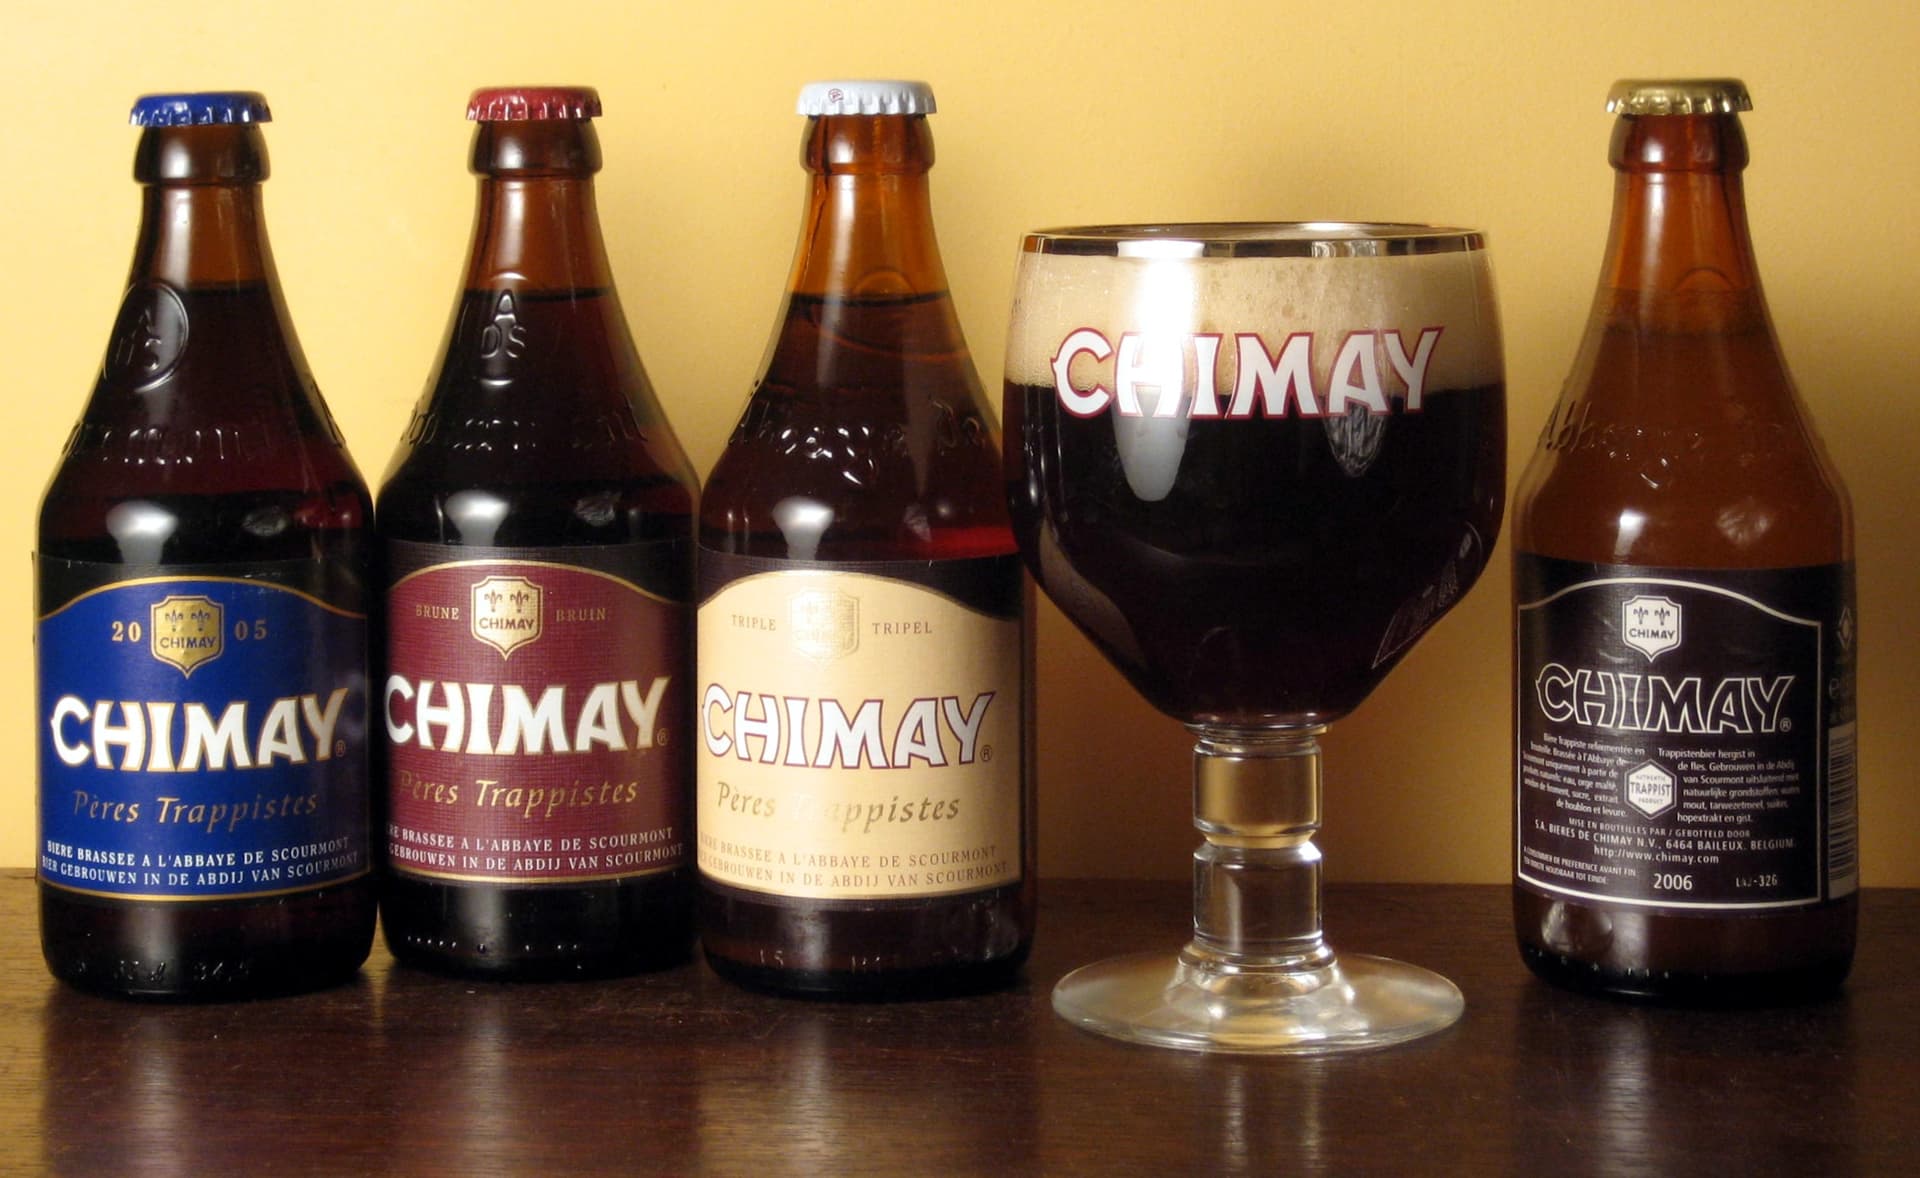
you can see what my favorite ■■■■ and some movies are what are yours
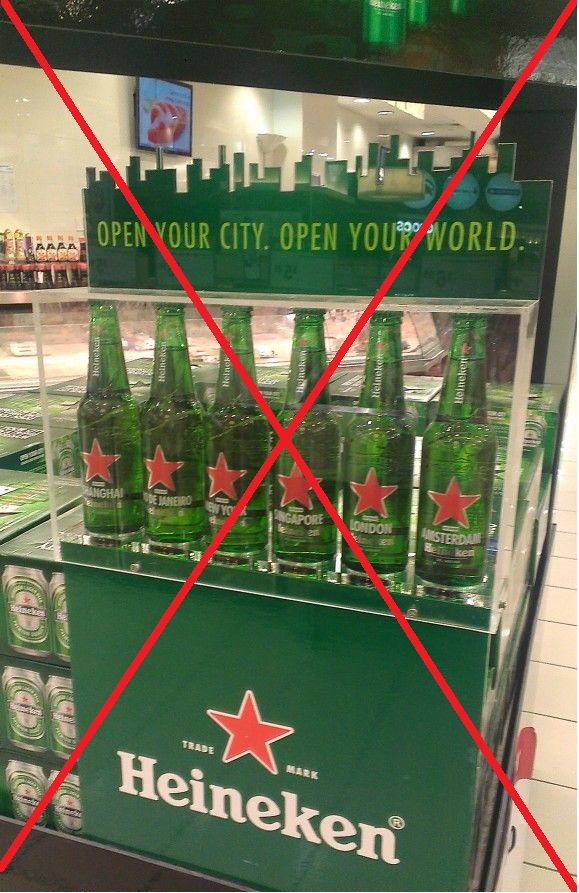
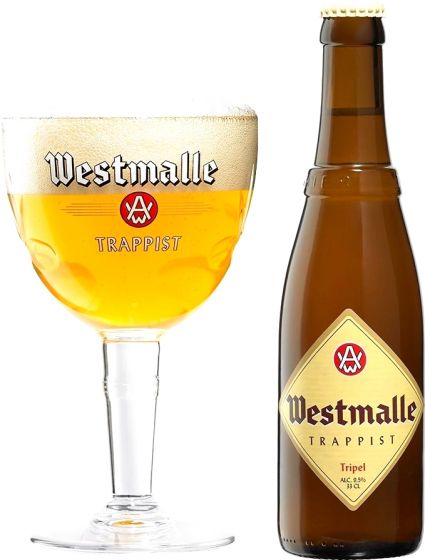
Grolsch and Hertog Jan are imho the best pilseners from The Netherlands. I was mocking the guests at Capo’s for bringing Heineken. I doubt however that you can get better ■■■■ at their location. So I may have judged too soon. Budweiser is no better than Heineken. Budvar on the other hand, is. My favorite beers are from Belgium. Not pilseners mind you but Trappists. I love Westmalle triple, Rochefort, Chimay.
Living close to Belgium I might be a bit spoiled. I wonder if you can get these at GMT+3 ?
Movies. I like movies from the sixties. Michelangelo Antonioni, François Truffaut, Federico Fellini. My favorite genre however is science fiction. Not Star Wars! Anyone seen “Moon” or “Contact”?


1 Like
This. I’m into Trappists myself too. After getting them to know after lots of Irish sorts I can no longer consume “generic” beers. In comparison with such things like Rochefort & Chimay all the other non-Belgium beers taste like nothing to me since this encounter many many years ago
1 Like
What do you get when you bring Dutch and Russians together

Ukraine has 0.00 a_____l when driving.
Russia has changed from 0.00 to 0.3 per thousand.
The penalties are quite high, for example 750€ in Russia. (but you have to keep in mind that you have in Russia for a smaller income)
But much is also about relationships or bribes.
Some sources say it has changed for the better in recent years, plus, in general, consumption of a_____l has dropped significantly as well;
The country with the highest a_____l consumption per citizen per year is Australia ![]()
1 Like
Yes, that’s true
1 Like
What source do you have? My information looks different.
It also becomes interesting when you see the type of a_____l. ■■■■ compared to vodaka (or similar)
1 Like
But it’s more about frequency of being _____, not amount of consumed a_____l; here ranking would obviously look differently;
1 Like
Okay in that case it is different:
| Country | Both Sexes (L/year) | Male (L/year) | Female (L/year) |
|---|---|---|---|
| Latvia | 13.19 | 21.61 | 6.31 |
| Moldova | 12.85 | 20.61 | 5.89 |
| Germany | 12.79 | 19.71 | 6.15 |
| Lithuania | 12.78 | 20.6 | 6.3 |
| Ireland | 12.75 | 19.38 | 6.34 |
| Spain | 12.67 | 19.94 | 5.76 |
| Uganda | 12.48 | 20.61 | 4.94 |
| Bulgaria | 12.46 | 19.86 | 5.59 |
| Luxembourg | 12.45 | 18.74 | 6.08 |
| Romania | 12.34 | 19.5 | 5.68 |
| Andorra | 12.26 | 18.58 | 5.74 |
Whole list:
| Country | Both Sexes (L/year) | Male (L/year) | Female (L/year) |
|---|---|---|---|
| Latvia | 13.19 | 21.61 | 6.31 |
| Moldova | 12.85 | 20.61 | 5.89 |
| Germany | 12.79 | 19.71 | 6.15 |
| Lithuania | 12.78 | 20.6 | 6.3 |
| Ireland | 12.75 | 19.38 | 6.34 |
| Spain | 12.67 | 19.94 | 5.76 |
| Uganda | 12.48 | 20.61 | 4.94 |
| Bulgaria | 12.46 | 19.86 | 5.59 |
| Luxembourg | 12.45 | 18.74 | 6.08 |
| Romania | 12.34 | 19.5 | 5.68 |
| Andorra | 12.26 | 18.58 | 5.74 |
| Montenegro | 12.24 | 19.51 | 5.3 |
| France | 12.23 | 19.21 | 5.83 |
| Slovenia | 12.11 | 18.68 | 5.67 |
| Portugal | 12.09 | 19.51 | 5.59 |
| Laos | 12.08 | 19.11 | 5.09 |
| Tanzania | 12.04 | 19.89 | 4.36 |
| Austria | 11.93 | 18.42 | 5.76 |
| Poland | 11.89 | 18.65 | 5.65 |
| United Kingdom | 11.45 | 17.74 | 5.4 |
| Switzerland | 11.23 | 17.18 | 5.45 |
| Hungary | 11.07 | 17.66 | 5.24 |
| Slovakia | 11.06 | 17.26 | 5.3 |
| Burkina Faso | 11.05 | 18.5 | 3.85 |
| Belarus | 10.96 | 17.93 | 5.13 |
| Cook Islands | 10.94 | 17.95 | 4.36 |
| Cyprus | 10.8 | 16.92 | 4.76 |
| Belgium | 10.8 | 16.7 | 5.13 |
| Estonia | 10.75 | 17.35 | 5.06 |
| New Zealand | 10.69 | 16.46 | 5.23 |
| Finland | 10.65 | 16.56 | 4.99 |
| Greece | 10.5 | 16.72 | 4.6 |
| Russia | 10.5 | 17.99 | 4.31 |
| Barbados | 10.37 | 16.95 | 4.35 |
| Australia | 10.36 | 15.72 | 5.11 |
| Denmark | 10.13 | 15.58 | 4.8 |
| Japan | 10.09 | 15.58 | 4.93 |
| United States | 9.97 | 15.44 | 4.69 |
| Niue | 9.93 | 16.04 | 3.77 |
| Netherlands | 9.67 | 14.9 | 4.54 |
| Saint Lucia | 9.59 | 15.45 | 3.97 |
| Georgia | 9.47 | 15.61 | 4.11 |
| Argentina | 9.45 | 14.66 | 4.64 |
| South Africa | 9.45 | 15.74 | 3.46 |
| Antigua And Barbuda | 9.4 | 15.09 | 4.25 |
| Iceland | 9.21 | 14.03 | 4.39 |
| Sweden | 9.04 | 13.85 | 4.27 |
| Grenada | 8.96 | 14.25 | 3.64 |
| Chile | 8.95 | 13.74 | 4.36 |
| Serbia | 8.85 | 14.09 | 3.93 |
| Seychelles | 8.84 | 13.41 | 4.02 |
| Canada | 8.81 | 13.73 | 4.01 |
| Eswatini | 8.78 | 14.78 | 3.26 |
| Croatia | 8.73 | 13.96 | 3.99 |
| Thailand | 8.5 | 13.75 | 3.61 |
| South Korea | 8.45 | 12.76 | 4.17 |
| Ukraine | 8.34 | 14 | 3.65 |
| Malta | 8.27 | 12.88 | 3.69 |
| Gabon | 8.08 | 12.24 | 3.7 |
| Italy | 8.01 | 12.74 | 3.61 |
| Rwanda | 7.96 | 13.11 | 3.11 |
| Vietnam | 7.93 | 12.84 | 3.19 |
| Cambodia | 7.84 | 12.9 | 3.21 |
| Angola | 7.83 | 12.39 | 3.48 |
| Bosnia And Herzegovina | 7.81 | 12.95 | 2.96 |
| Panama | 7.77 | 12.23 | 3.36 |
| Burundi | 7.45 | 12.22 | 2.89 |
| Suriname | 7.4 | 11.74 | 3.1 |
| Brazil | 7.32 | 11.65 | 3.22 |
| Dominica | 7.23 | 11.53 | 2.9 |
| Saint Vincent And the Grenadines | 7.15 | 11.29 | 2.87 |
| Norway | 7.14 | 10.8 | 3.45 |
| Philippines | 7.02 | 11.22 | 2.87 |
| Paraguay | 7.01 | 10.96 | 2.94 |
| Equatorial Guinea | 6.92 | 9.63 | 3.12 |
| Uruguay | 6.92 | 10.82 | 3.38 |
| Albania | 6.82 | 11.02 | 2.53 |
| Peru | 6.78 | 10.41 | 3.24 |
| Dominican Republic | 6.68 | 10.62 | 2.8 |
| Botswana | 6.61 | 11.1 | 2.61 |
| Trinidad And Tobago | 6.52 | 10.24 | 2.94 |
| North Macedonia | 6.43 | 10.36 | 2.54 |
| Belize | 6.37 | 10.18 | 2.65 |
| Saint Kitts And Nevis | 6.34 | 10.01 | 2.78 |
| Cuba | 6.26 | 9.97 | 2.64 |
| Nigeria | 6.19 | 9.84 | 2.49 |
| China | 6.04 | 9.37 | 2.6 |
| Mongolia | 5.9 | 9.23 | 2.72 |
| Sao Tome And Principe | 5.8 | 9.15 | 2.49 |
| India | 5.61 | 9.06 | 1.89 |
| Guinea Bissau | 5.54 | 9.32 | 2.09 |
| Cameroon | 5.52 | 8.76 | 2.32 |
| Colombia | 5.45 | 8.84 | 2.27 |
| Liberia | 5.37 | 8.58 | 2.2 |
| Guyana | 5.33 | 8.57 | 2.1 |
| Sierra Leone | 5.31 | 9.19 | 1.47 |
| Lesotho | 5.08 | 8.65 | 1.67 |
| Nicaragua | 5.07 | 8.31 | 2.02 |
| Mexico | 5.05 | 8.13 | 2.18 |
| Kazakhstan | 5 | 8.33 | 2.02 |
| Kyrgyzstan | 4.85 | 8.38 | 1.51 |
| Bahamas | 4.8 | 7.66 | 2.16 |
| Mauritius | 4.78 | 7.67 | 2 |
| Armenia | 4.67 | 7.7 | 2.14 |
| Zimbabwe | 4.52 | 7.94 | 1.62 |
| Zambia | 4.46 | 7.26 | 1.79 |
| Israel | 4.38 | 6.84 | 2.02 |
| Nauru | 4.18 | 7.07 | 1.46 |
| Jamaica | 4.16 | 6.71 | 1.69 |
| North Korea | 4.16 | 6.89 | 1.61 |
| El Salvador | 4.09 | 6.91 | 1.75 |
| Malawi | 4.08 | 6.76 | 1.56 |
| Costa Rica | 4.07 | 6.49 | 1.68 |
| Honduras | 3.93 | 6.34 | 1.57 |
| Bolivia | 3.91 | 6 | 1.84 |
| United Arab Emirates | 3.85 | 4.97 | 0.87 |
| Fiji | 3.68 | 6.08 | 1.23 |
| Venezuela | 3.56 | 5.72 | 1.51 |
| Gambia | 3.36 | 5.73 | 1.09 |
| Ecuador | 3.27 | 5.01 | 1.56 |
| Namibia | 3.15 | 5.3 | 1.2 |
| Turkmenistan | 3.09 | 5.26 | 1.03 |
| Ivory Coast | 3.04 | 4.83 | 1.19 |
| Haiti | 3.02 | 4.96 | 1.19 |
| Sri Lanka | 2.87 | 4.75 | 1.19 |
| Samoa | 2.82 | 4.58 | 0.93 |
| Maldives | 2.78 | 3.95 | 0.57 |
| Ghana | 2.78 | 4.37 | 1.16 |
| Mozambique | 2.69 | 4.53 | 1.04 |
| Togo | 2.66 | 4.25 | 1.1 |
| Uzbekistan | 2.61 | 4.48 | 0.79 |
| Micronesia | 2.51 | 4.14 | 0.85 |
| Kiribati | 2.32 | 3.97 | 0.8 |
| Benin | 2.23 | 3.59 | 0.9 |
| Ethiopia | 2.2 | 3.66 | 0.78 |
| Kenya | 2.15 | 3.51 | 0.83 |
| Myanmar | 2.14 | 3.57 | 0.85 |
| Papua New Guinea | 2.12 | 3.49 | 0.72 |
| Eritrea | 2.11 | 3.52 | 0.73 |
| Vanuatu | 2.1 | 3.48 | 0.73 |
| Tunisia | 2.04 | 3.61 | 0.53 |
| Singapore | 2 | 2.92 | 0.99 |
| Madagascar | 1.98 | 3.22 | 0.77 |
| Turkey | 1.77 | 3.12 | 0.48 |
| Solomon Islands | 1.74 | 2.87 | 0.59 |
| Central African Republic | 1.71 | 2.76 | 0.71 |
| Guatemala | 1.63 | 2.63 | 0.69 |
| Lebanon | 1.53 | 2.58 | 0.49 |
| Qatar | 1.51 | 1.81 | 0.38 |
| Tuvalu | 1.31 | 2.26 | 0.45 |
| Mali | 1.31 | 2.26 | 0.39 |
| Chad | 1.26 | 2.07 | 0.46 |
| Comoros | 1.15 | 2 | 0.3 |
| Bahrain | 1.13 | 1.54 | 0.32 |
| DR Congo | 1.1 | 1.76 | 0.46 |
| Guinea | 1.09 | 1.94 | 0.36 |
| Iran | 1.01 | 1.76 | 0.25 |
| Azerbaijan | 0.98 | 1.67 | 0.32 |
| Malaysia | 0.93 | 1.48 | 0.35 |
| Oman | 0.92 | 1.22 | 0.23 |
| Tajikistan | 0.88 | 1.49 | 0.26 |
| Senegal | 0.73 | 1.3 | 0.22 |
| Algeria | 0.63 | 1.09 | 0.17 |
| Nepal | 0.62 | 1.1 | 0.25 |
| Timor Leste | 0.53 | 0.84 | 0.21 |
| Jordan | 0.52 | 0.89 | 0.14 |
| Niger | 0.52 | 0.89 | 0.15 |
| Morocco | 0.49 | 0.87 | 0.13 |
| Brunei | 0.46 | 0.68 | 0.21 |
| Tonga | 0.43 | 0.73 | 0.15 |
| Iraq | 0.37 | 0.64 | 0.1 |
| Djibouti | 0.36 | 0.6 | 0.093 |
| Pakistan | 0.31 | 0.52 | 0.095 |
| Indonesia | 0.22 | 0.37 | 0.063 |
| Bhutan | 0.21 | 0.33 | 0.077 |
| Syria | 0.19 | 0.32 | 0.047 |
| Egypt | 0.14 | 0.24 | 0.037 |
| Yemen | 0.034 | 0.059 | 0.009 |
| Libya | 0.027 | 0.047 | 0.007 |
| Afghanistan | 0.013 | 0.022 | 0.003 |
| Kuwait | 0 | 0 | 0 |
| Mauritania | 0 | 0 | 0 |
| Somalia | 0 | 0 | 0 |
| Saudi Arabia | 0 | 0 | 0 |
| Bangladesh | 0 | 0 | 0 |
1 Like
Here’s a chart of 188 Countries by A_____l Consumption Per Capita, published two months ago, based on the latest available data. Australia was number 27. Cook Islands was number one. They beat out Australia by 3.5 liters per capita. You can also filter the data by five different categories: all types of a_____l, ■■■■, ■■■■, distilled spirits and other. The country list is after the maps.
https://www.visualcapitalist.com/mapped-countries-by-a_____l-consumption-per-capita/
1 Like
Looool what is wrong with the people on Cook Islands? ![]()
![]()
They probably feel very isolated ![]()
1 Like